


Usually Stock Markets bottom at the extreme panic level, when the pessimism is at its peak, when we think world is going to end, that’s when the stock market actually starts bottoming out.

If there is one Indicator which can tell us whether market is bottomed out, then its none other than the Volatility index. The VIX called as fear index, actually represents how fearful the investors are. Investors rush to buy put options to protect their portfolio during panic situation, that’s why VIX shoots up during market crash. We shall analyse how VIX moved during the last two market crash, during dot com bubble burst and during 2008 global financial crisis.
Here’s the analysis of last 20 years data of US Volatility index chart from 2000 to 2020, (India VIX was introduced only during 2009/10 so we need to us US data for analysis )as you can see in the below chart, the dot com bubble burst in 2002 and 2008 Financial crisis period.
- By Dec 2002 Vix corrected -45% from its peak
- By Dec 2008 VIX corrected -58% from its peak
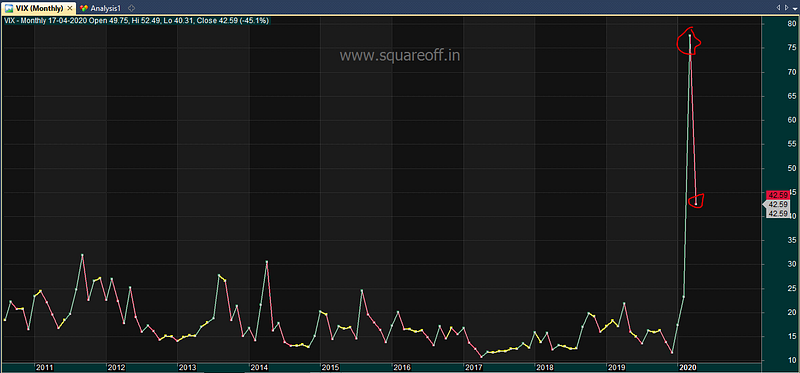
- By March 2020 VIX corrected -55% from its peak

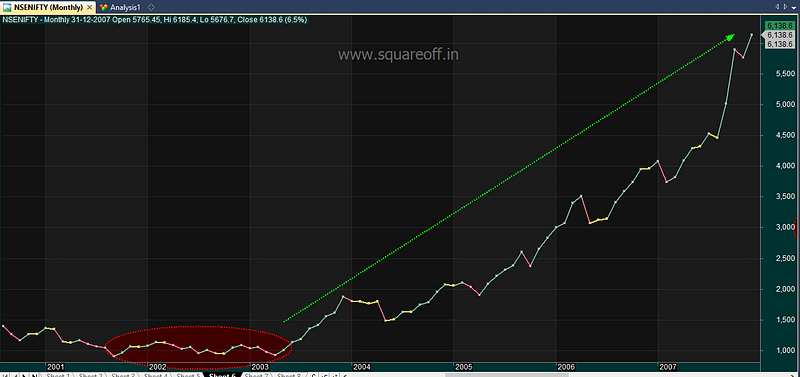
Dot com crash:
VIX raised to 40 levels at the peak in 2002 and eventually VIX cooled off and came back to 20 levels, it corrected about -45%, and that’s exactly where the Markets bottomed out in 2002. Nifty rallied from 1000 levels in the year 2002 to 6000 levels by 2008, a 500% rise.
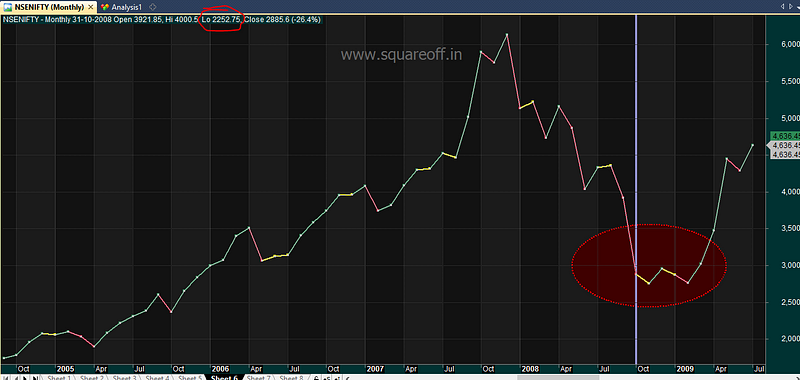
Global financial crisis in 2008:
And then came the Global financial crisis in 2008, where by Oct 2008 the Lehman collapse happened, the fear was at the highest among investors, making US VIX reaching upto 90. From 90 Vix levels, it dropped to less than 40 by December 2008, a -55% correction in VIX which denotes that the fear among the investors has come down drastically .And that’s exactly where Nifty made bottom around 2900 levels in Dec 2008.
VIX continued to slide down and remember this when the Investors and media were talking about double dip recession. And were expecting more downside in markets. But that never happened, instead market started moving upside.
From Dec 2008 to Dec 2019, Nifty moved from 3000 levels to 12000 levels, 300% rise. When all global markets were trading near all time high, then came the Corona Virus.
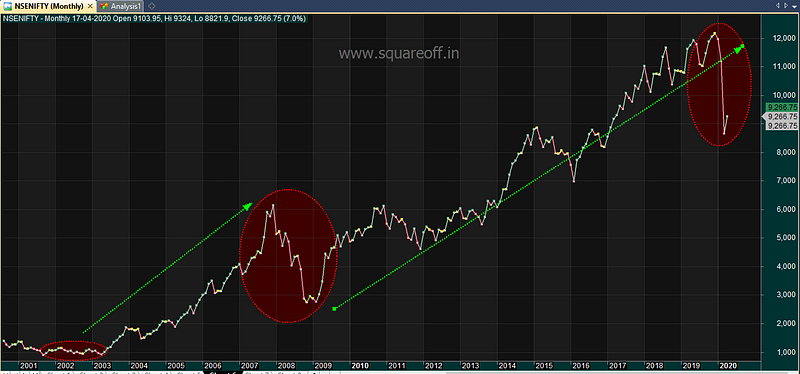
Corona Virus 2020:
With extreme panic sets in by March 2020, where death toll across the globe increasing rapidly and cases reported in multiple countries were soaring high day by day, Market tanked and India VIX hit all time high of 86 levels and now it has dropped to 40 levels, more than -50% correction from its peak.
Nifty dropped like a stone in March 2020, hitting lower circuits and reaching 7500 levels. If the VIX had continued like that, we could have faced more correction and Nifty would have undergone a much steeper correction.
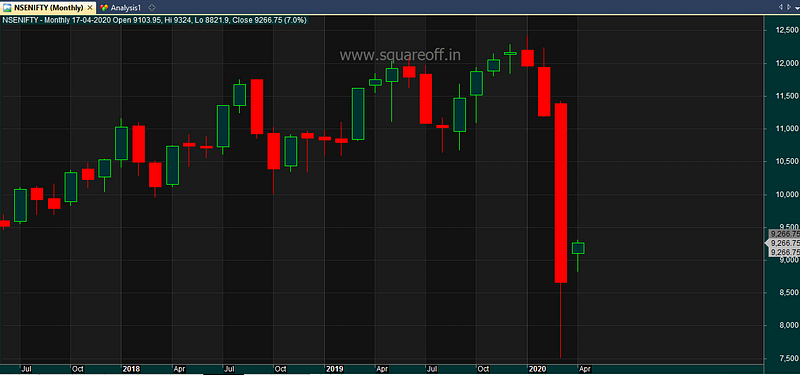
Just like during the last two crisis period, investors and media was reporting extreme negative news as if the world is going to end. But Market did exactly the opposite, Nifty moving up +25% from its recent low and VIX cooling off drastically from its recent peak denotes the fear factor is lower among investors now and also signifies the market has actually bottomed out if we compare the same with last two crisis.
Those who did not wait for the bottom and made their long term purchase at the extreme panic when markets locked in lower circuit in March 2020 has really made a good rational decision instead of waiting to bottom fish. If you are still waiting for more confirmation or Corona to get settled down, you probably will be too late. Better start fishing now.
If you liked this article, please do share share it (Whatsapp, Twitter) with other Traders/Investors.
Didn’t u post it on twitter in April??
Yes, did that