

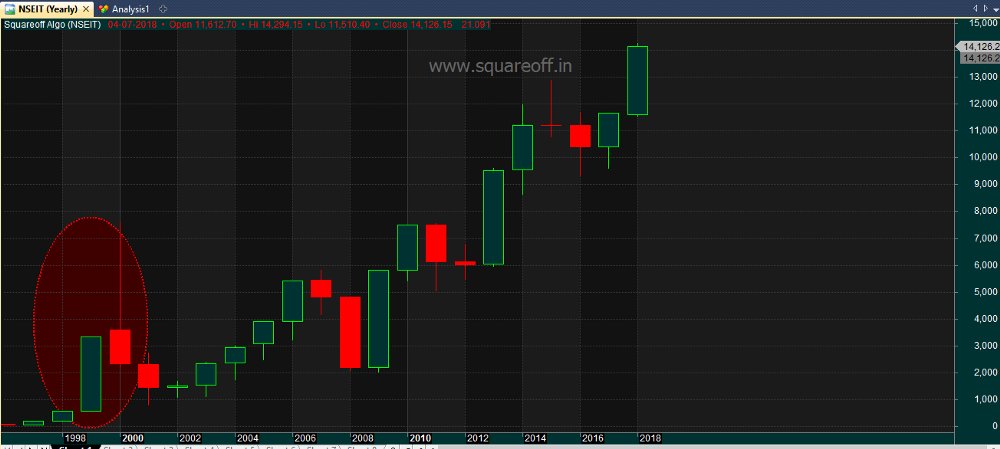
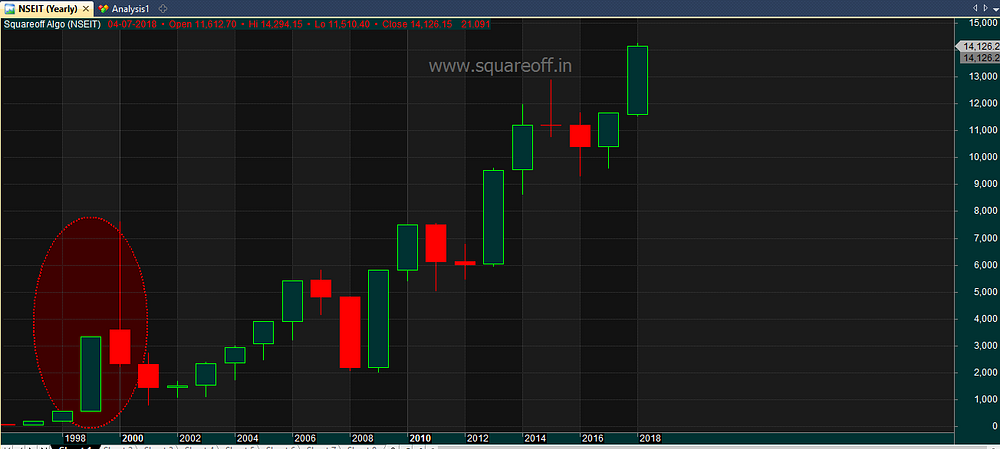
Let’s analyse the historical data of Indian Stock market for last 22 years to see what really happened. There has been two severe crash Indian stock market witnessed, one in 2000/01 which was caused by Internet/IT stocks, the dot com bubble was burst.
Another one was in 2008, caused by global financial crisis. If we observe the data, there are two similarities between 2000 and 2008 crash. Before the 2000 crash, there was a sudden huge interest among IT stocks, people went crazy and started buying IT stocks without giving much importance to valuations.
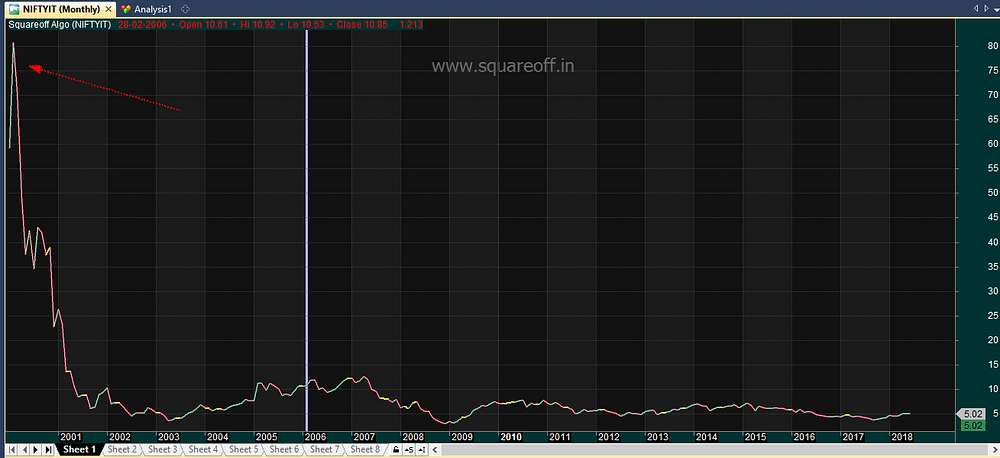
Many IT companies were zooming like anything during the period of 1998 to 2000. NIFTYIT Index gained more than 3600% within 3 years of time.
We all know that PE ratio is widely tracked by everyone and investors do make certain decision based out of it. But there is one more ratio called PB ratio. Here’s the PB ratio of Nifty IT index, crazy valuation. PB ratio was more than 80. People did not care about the valuation, as the stock price kept on roaring higher and higher.
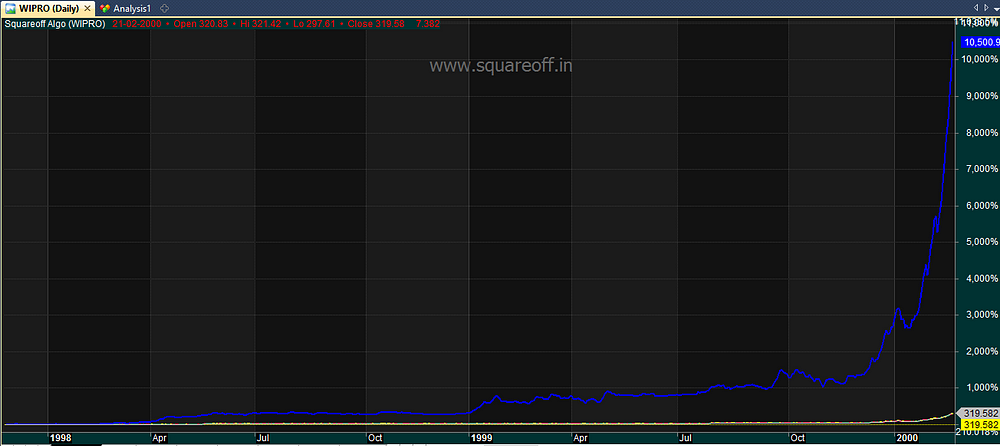
Look at the madness, the stock price of Wipro gained more than 10,000% between 1998 to 2000.
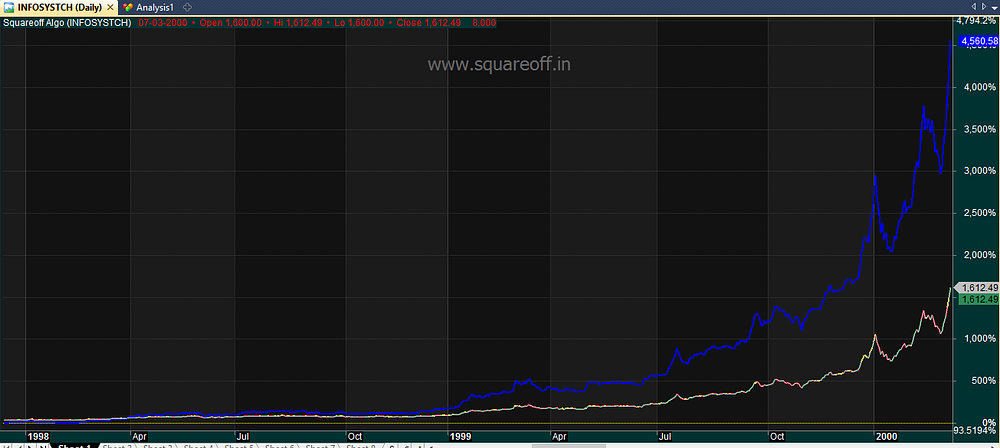
the stock price of Infosys gained more than 4,000% between 1998 to 2000
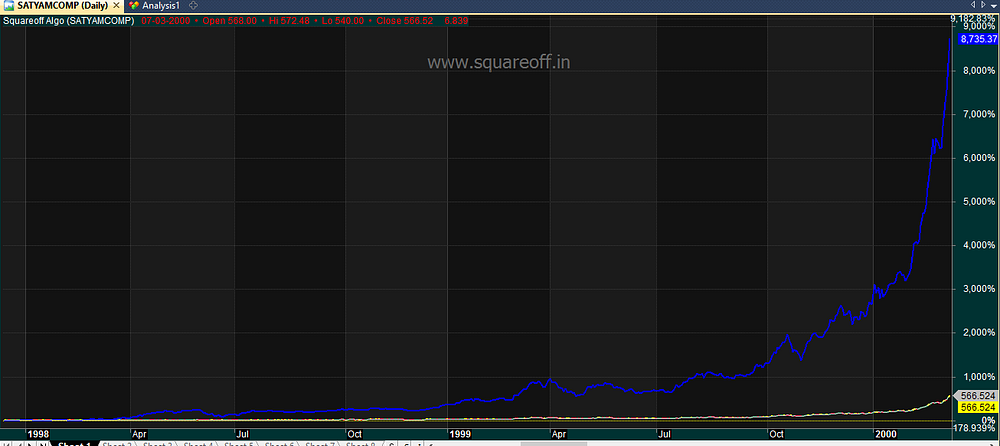
the stock price of Satyam Computer gained more than 9,000% between 1998 to 2000
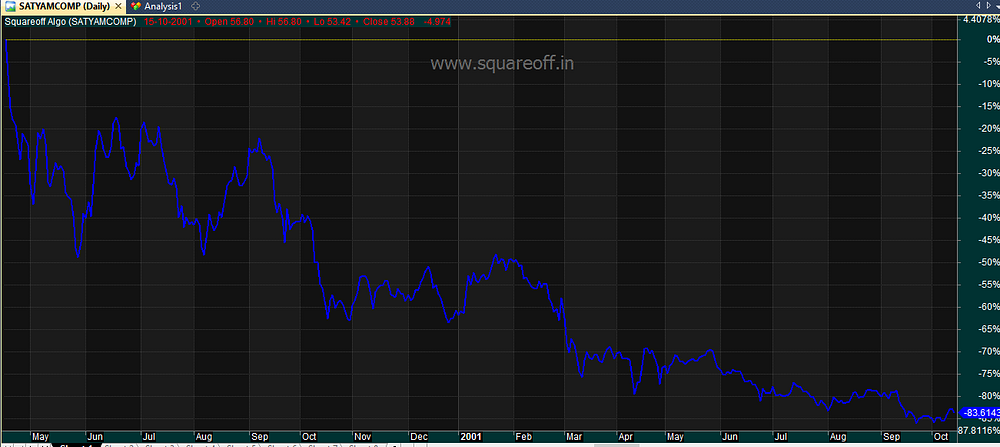
Any companies that deals with IT went only up, a new era of business, Internet is going to be the future, Indian IT companies going to be super star, blah..blah..blah.. but what happened after that? boom! Big crash, all IT stocks went down crashing more than -85%.
Before the market crash of 2000, there was IT bubble, valuations sky rocketed and eventually ended up with huge crash.
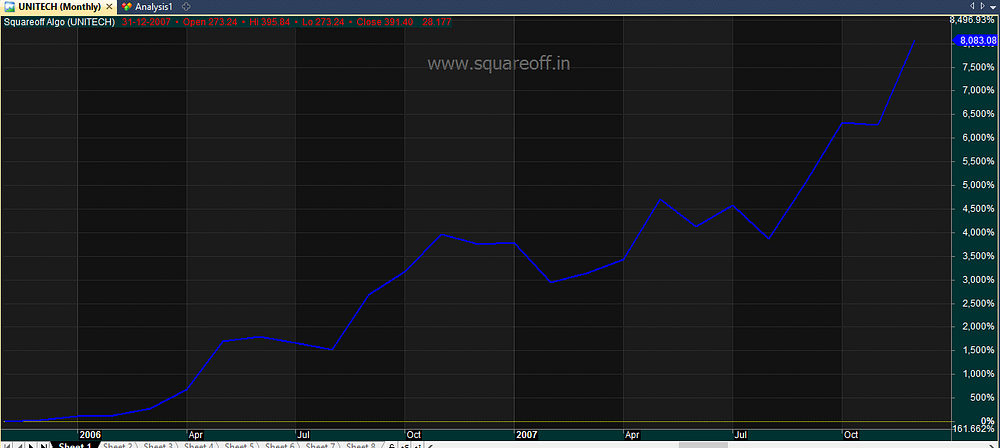
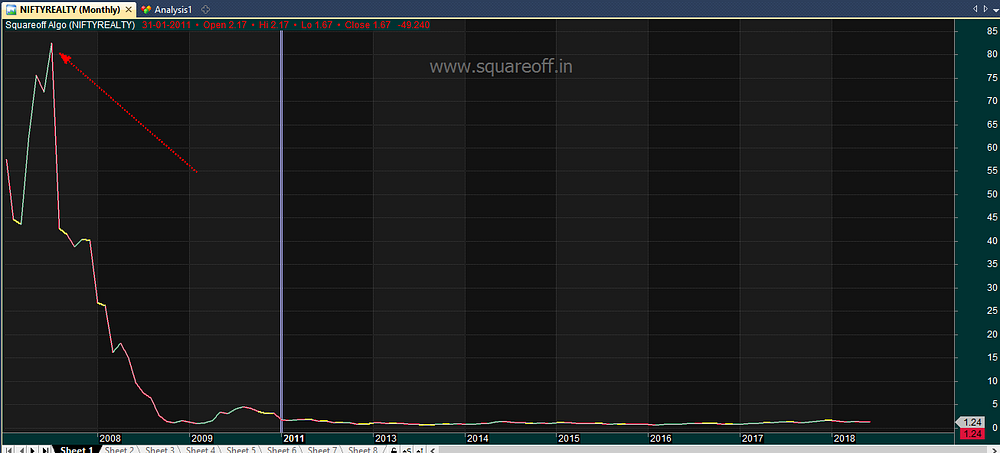
Similarly, which sector played a vital role in 2008 crash? It was Real Estate sector.
Look at the price appreciation of Unitech, it moved more than 8000% between 2006 to 2007.
The valuation of Real Estate sector was so high, PB ratio of Nifty Realty index was greater than 80 which eventually crashed in the year 2008.
During the crash of year — 2000 and 2008, there was one sector that was gaining very high momentum, leading to sky rocketing valuations which was visible in PB ratio of the respective index.
In order to find, if we are really heading for another crash, check out which sector is gaining more momentum and going beyond valuation. That should be the sign of warning, check if the PB ratio of the respective index is moving higher and higher, if you find such similarity again, we can be sure that we are heading for another crash. With current data & metrics, we are no where near bubble territory, there is a long way to go before we expect any crash.
For more such analysis and articles, follow us at our Telegram Channel and blog.